SignalDeskElizaveta Sluzhaeva · Product Design Case Study
Crypto Market Intelligence
Market monitoring, connected in one workspace.
A crypto market intelligence workspace for tracking assets, understanding signals and discovering market patterns.
Self-initiated portfolio concept · Solo Product Designer · Desktop web app · 22 screens & states
01 · Problem
Crypto monitoring is fragmented around tools, not tracked assets
Crypto investors don't lack data. They lack one place where tracked assets, risk conditions and context connect.
BasisCategory audit + public trading-community check-ins
User hypothesisActive crypto investors and analysts checking tracked assets repeatedly
The question every check-in starts with
“Which of my assets needs attention right now — and why?”
Charts→Derivatives→On-chain→News→Portfolio / watchlistOne check-in, every session
01
Tools default to the whole market
Users narrow global views back to their own assets manually.
02
Risk indicators are split by data type
Price, funding, flows and news rarely meet per asset.
03
Context is lost between tabs
By the fourth tool, it is hard to tell what changed — and why.
Main insight
Existing tools solve parts of the check-in, but not the connected workflow around tracked assets.
02 · Product model
One workspace organized around its Watchlist
SignalDesk connects monitoring, explanation and discovery around the assets a user has chosen to track.
MonitorWatchlist→Workspace widgets+Signals— one Watchlist drives the workspace
ExplainSignals→Signal Detail→Asset Preview— from trigger to explanation
DiscoverScreener→Add assets to workspace Watchlist— discovery closes the loop
Workspace
owns
Watchlistthe assets this workspace tracks
Widgets + Signals read from this Watchlist
Widgets · read
Signals · read
Screener · adds assets
↑Adds assets back into the Watchlist
Supporting surfaces
Asset PreviewMarket Brief
Core surfaces
WorkspaceMonitoring surface
WatchlistTracked assets
SignalsAttention layer
ScreenerMarket-wide discovery
03 · Reference landscape
Category patterns — and the gap SignalDesk targets
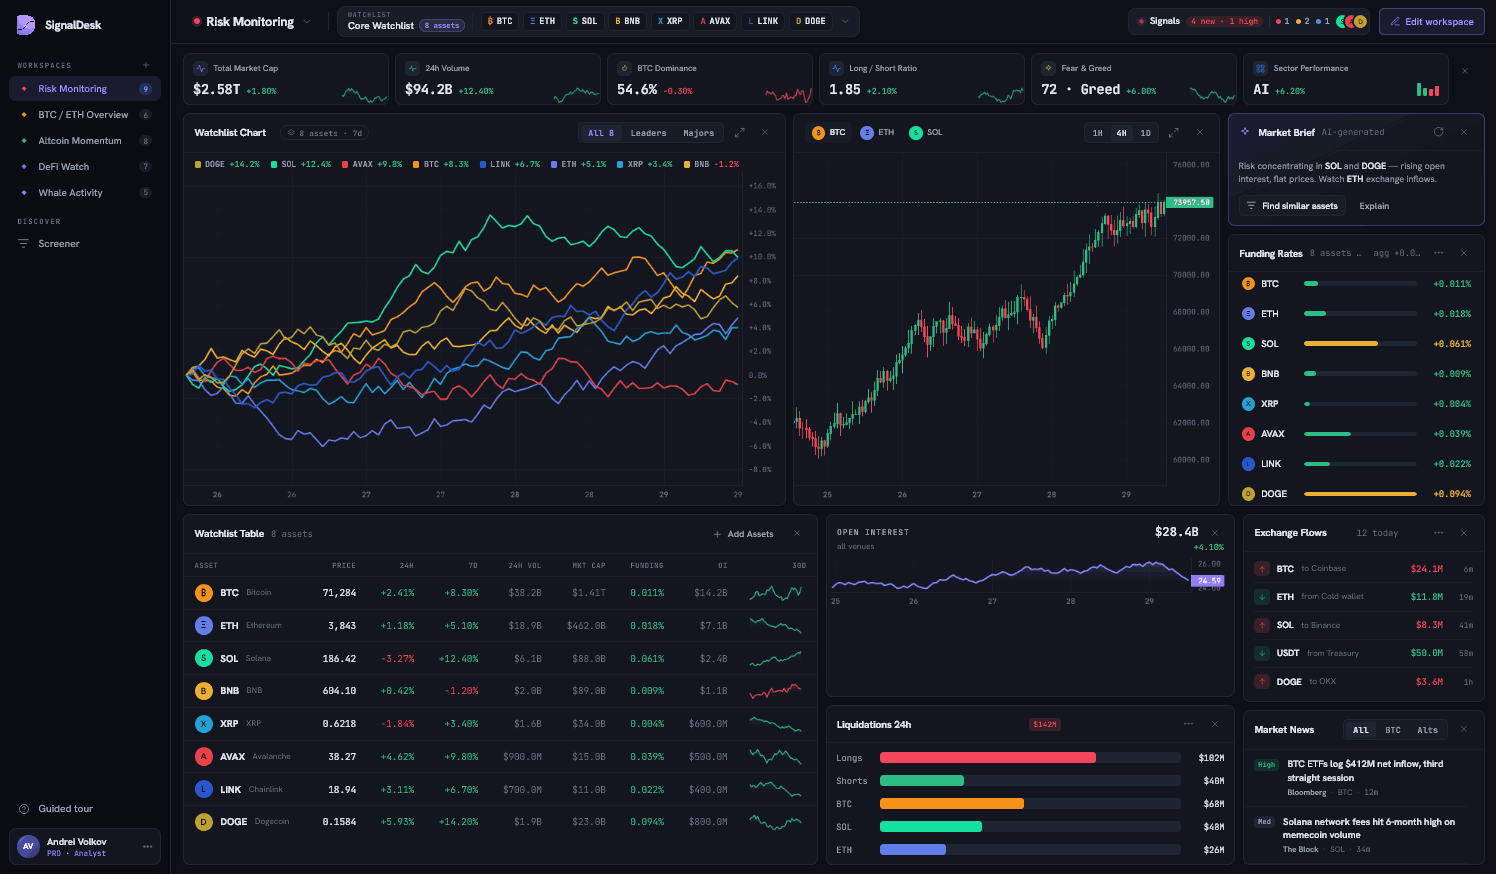
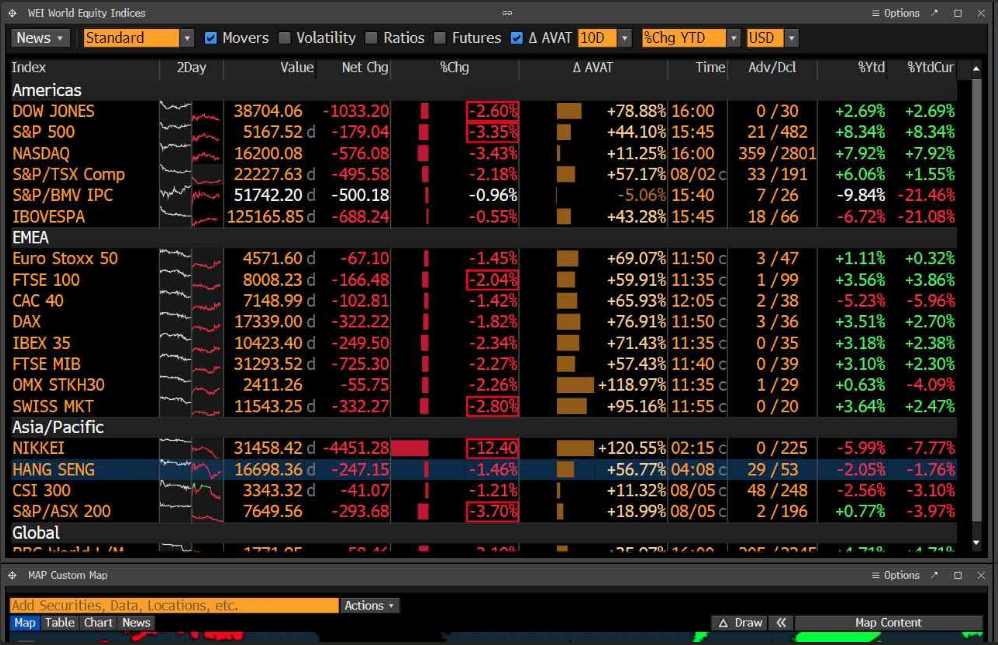
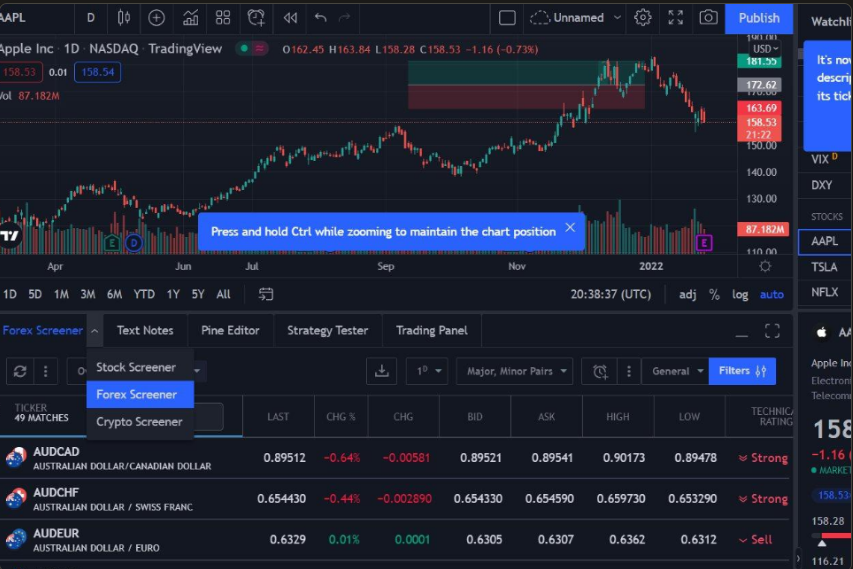
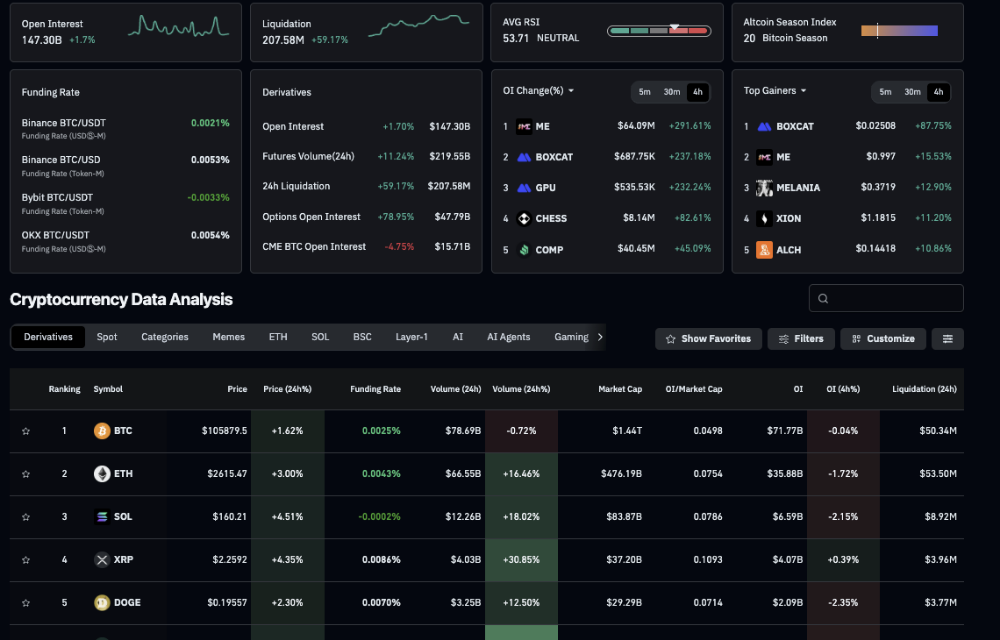
These references shaped the concept direction: dense data, saved views and advanced metrics are familiar patterns — the opportunity was to focus them around one tracked-asset check-in.
Bloomberg
PatternInstitutional cockpit; layout as an instrument.
GapBroad institutional toolset, heavier than a focused crypto check-in.
TradingView
PatternCharts, watchlists and screeners as daily habits.
GapGreat for analysis; SignalDesk explores a more opinionated monitoring loop.
CoinGlass
PatternDerivatives metrics are first-class.
GapMetrics-first view; less focused on a personalized monitoring surface.
Glassnode · Nansen · Dune
PatternOn-chain flows explain market moves.
GapDeep analysis layer; less focused on quick tracked-asset check-ins.
Opportunity
Build one workspace where tracked assets, signals and discovery stay connected.
04 · Model constraints
What I cut to keep the model clear
To keep the model understandable, I cut anything that created a second source of truth.
One workspace → one Watchlist → one source of truth
External inputScreener
adds assets to
Workspaceowns
Watchlistone source of truth
read from
WidgetsSignals
Early direction
Reusable Watchlists + templates
Why it failed: created two sources of truth.
Final direction
One workspace owns one Watchlist
Why it works: every widget, Signal and add action resolves to one list.
Deliberate trade-offs
Reusable Watchlists
Cut becausesecond source of truth.
Watchlist rebinding
Cut becauseunclear monitoring scope.
Templates
Cut becausewidget customization was enough.
Trading actions
Cut becausecontext, not financial advice.
Freeform canvas
Cut becausedense dashboards need control.
Result
Users always know what the workspace monitors — and why the screen changed.
05 · Core flow
Core flow: from first setup to market discovery
01Start
Setup
Assets and conditions, in the user's own words.
Workspace generation
A populated layout by default — blank workspace remains an escape hatch.
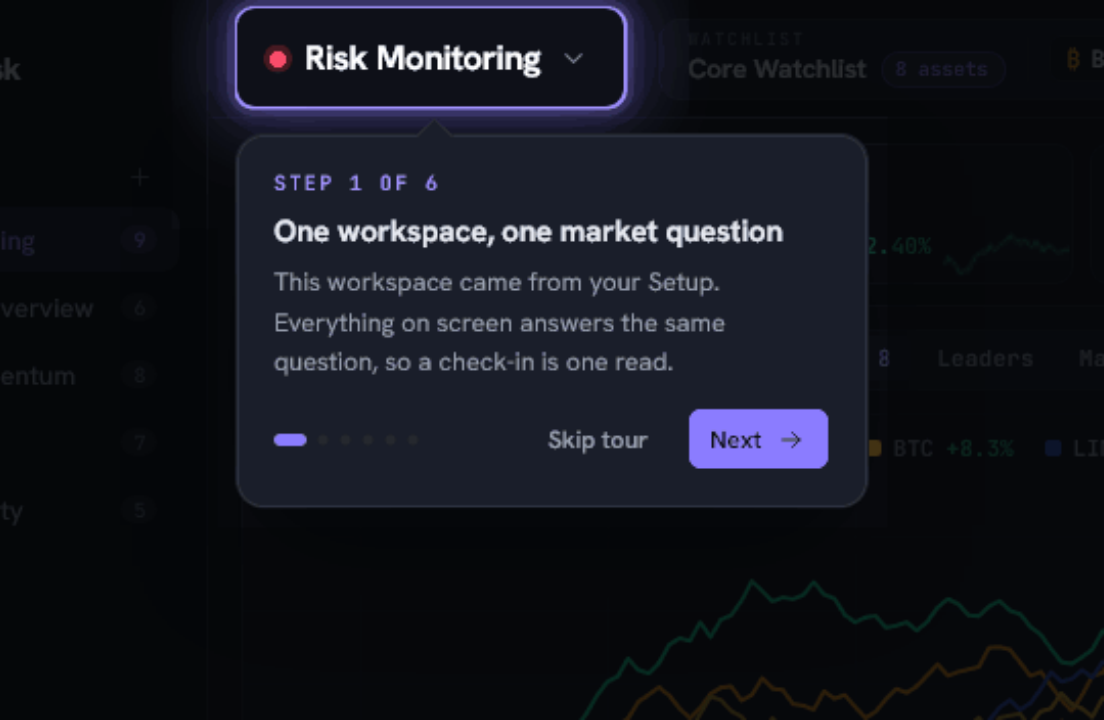
Guided Tour
Six steps on the model, not the controls.
→
02Monitor
Workspace
One read: Watchlist, evidence, Signals count.
Signal Detail
What fired, which drivers, how strong — then review.
Asset Preview
Context on one asset without losing the screen.
→
03Discover
Screener
Find assets matching the signal pattern.
Add to Watchlist
Add the asset to a chosen workspace’s Watchlist.
Workspace updates
Widgets and Signals recompute around it.
↰ back to Monitor
↺
A wider Watchlist changes what the workspace monitors — and which Signals can fire next.
06 · Key UX decisions
Eight decisions that shaped the product
Every decision protects one thing: users always know what this workspace monitors.
Mental model
01
Setup as the default path
A guided start avoids a cold dashboard.
02
Each workspace owns its Watchlist
One asset list answers: what am I looking at?
03
Templates removed from MVP
Customization already solves layout needs.
Attention, context & discovery
04
Signals are attention, not alerts
Signals are reviewed, not pushed as noise.
05
Screener is global, but connected
Discovery adds assets back to a named Watchlist.
06
Market Brief supports, never leads
AI summarizes context, not decisions.
Trust & control
07
No buy / sell recommendations
SignalDesk explains structure, never tells users what to trade.
08
Customization stays controlled
Users can adapt layout without breaking the system.
07 · Final solution
Walkthrough
Twenty-two screens and states, grouped by flow. The first five tabs show primary screens; System logic shows how the model holds under emptiness, selection, tracked context and reset.
DoWhy
08 · Guided Tour
The tour explains the mental model, not every control
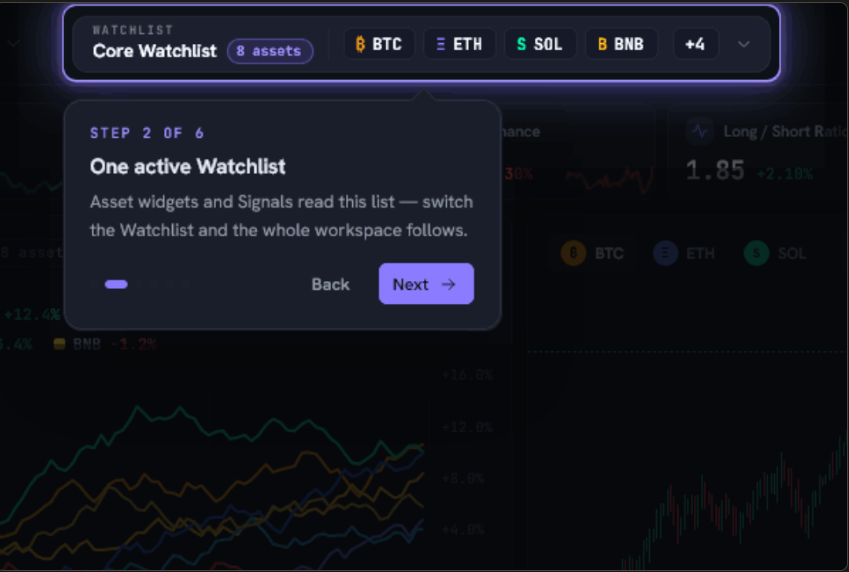
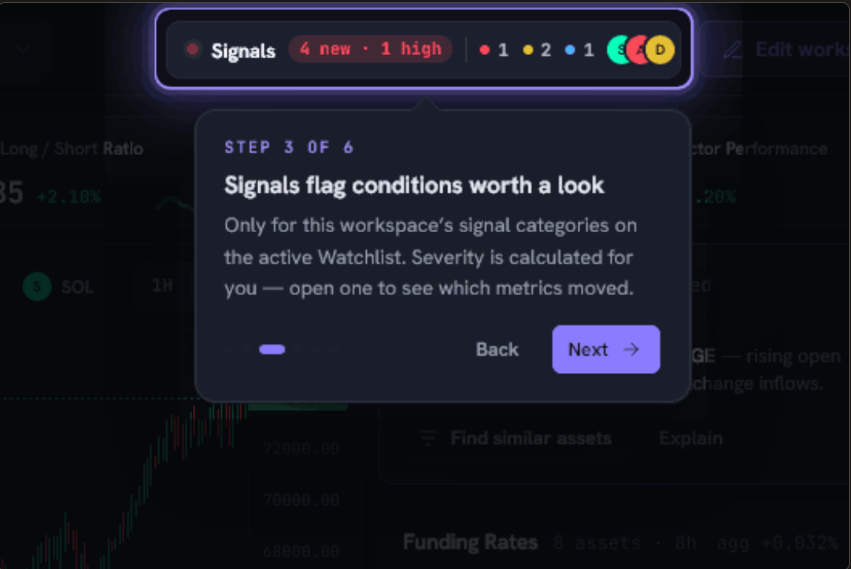
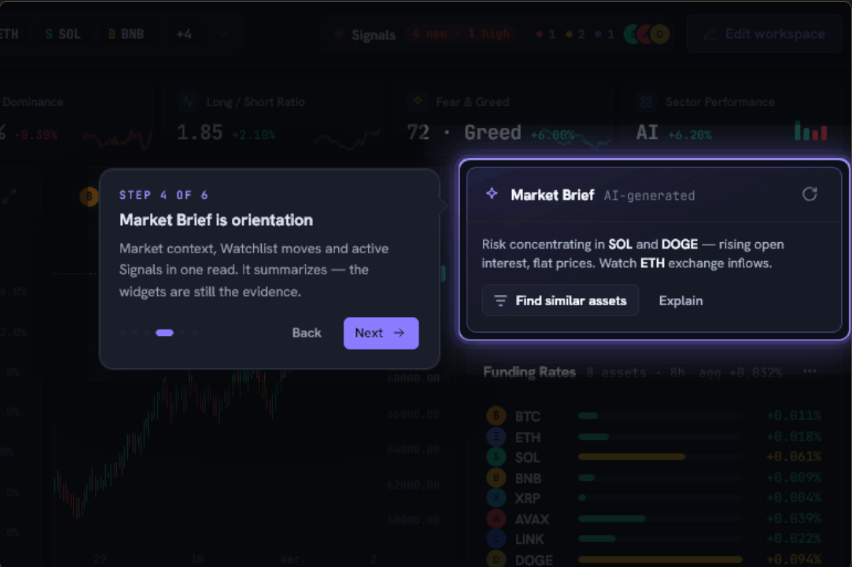
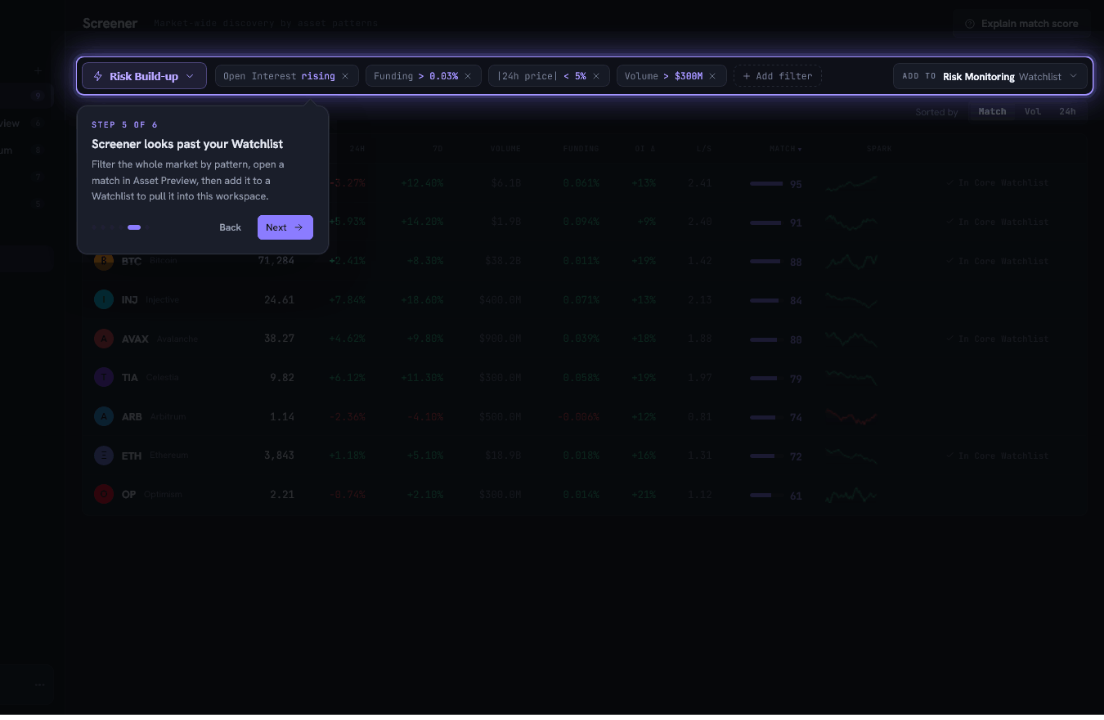
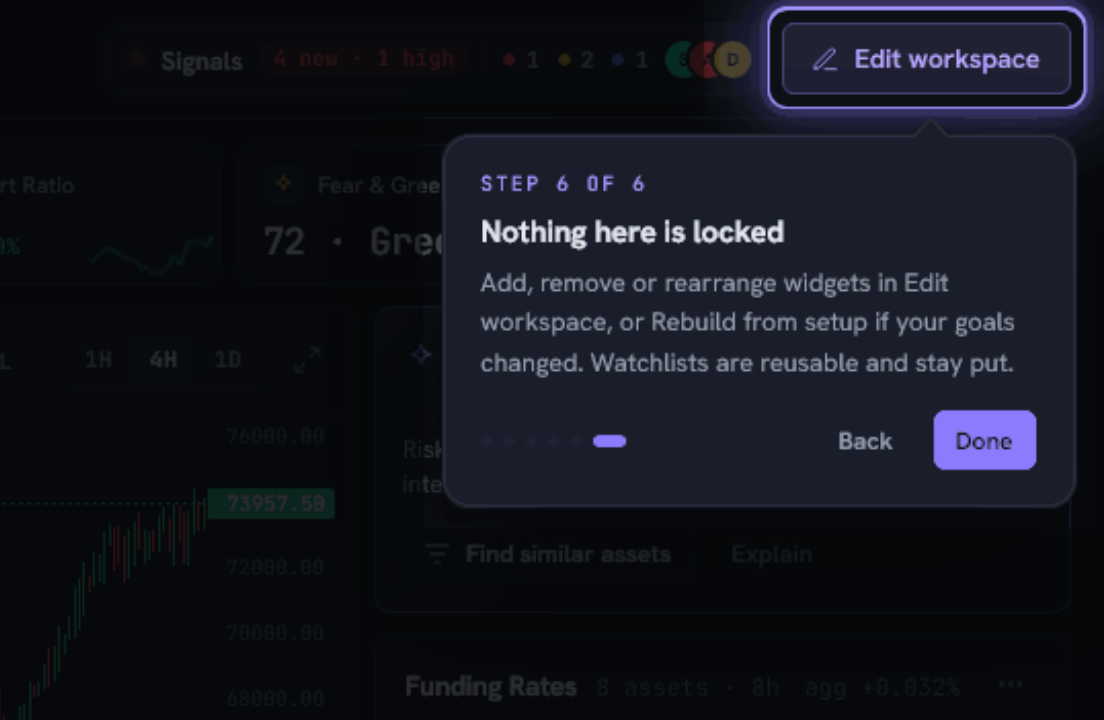
Six anchored steps introduce the mental model users need before reading dense market data: Workspace, Watchlist, Signals, Market Brief, Screener and Edit workspace.
01Workspace
One monitoring surface for the current market question.
02Watchlist
The assets this workspace tracks; widgets and Signals read from it.
03Signals
Conditions on tracked assets that need attention now.
04Market Brief
AI-generated context in one read — orientation, not advice.
05Screener
Find assets by market pattern and add them to a Watchlist.
06Edit workspace
Add, remove and rearrange widgets without breaking the layout.
09 · Design system
Dense without becoming a trading terminal
One dark surface scale, one accent color, and financial colors reserved for data only — never for decoration. Every screen is assembled from the same documented components, which is what keeps eleven widgets on one screen readable.
Widget card
Header, scope line and body — every workspace widget uses the same frame.
Signal card
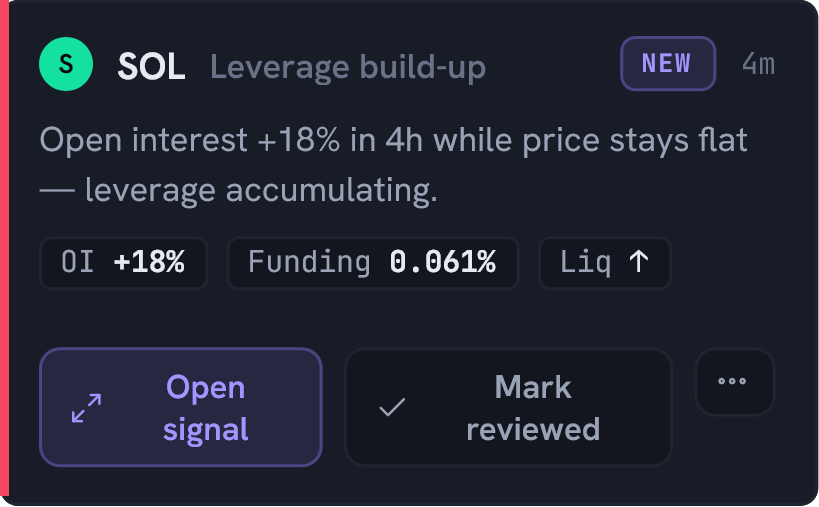
Asset, severity, plain-language cause and time since trigger, in one block.
Data table
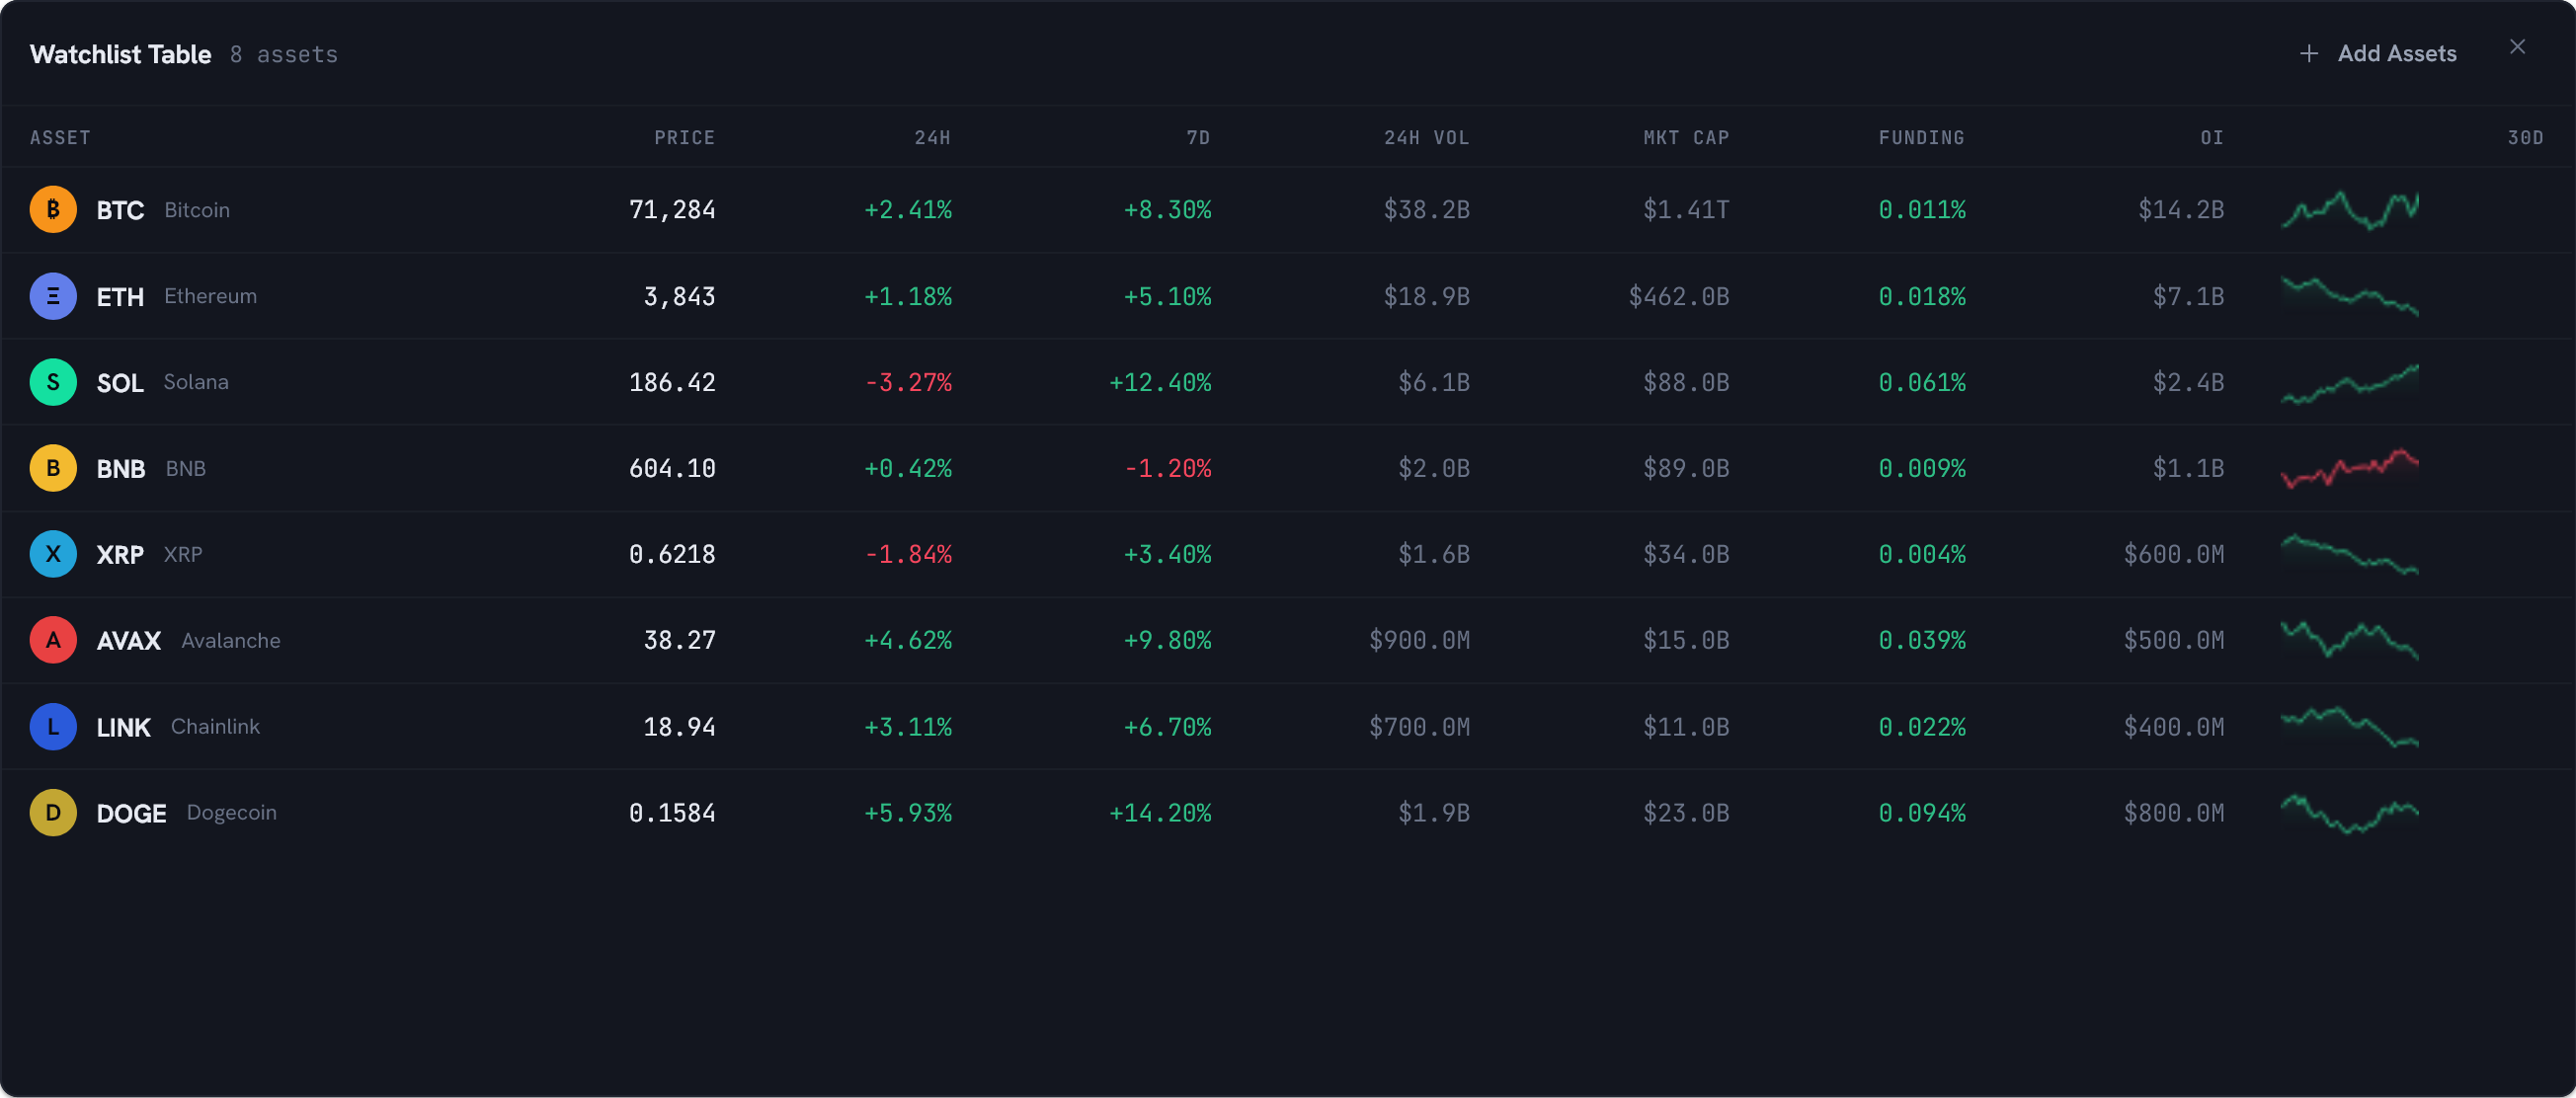
Mono figures with tabular numerals, hairline rows, color only on deltas.
Severity badge
New signal count with per-severity dots.
Drawer header
Identity, severity and context stay pinned while the body scrolls.
Watchlist chips
The active Watchlist and its assets, visible from every screen.
Reusable patterns across workspace, signals, screener and drawers
Widget cardsData tablesMetric chipsSignal cardsWatchlist chipsDrawersStatus badgesEmpty states
Type
Typography split
Grotesk for scanning. Mono for prices, deltas and labels.
Color
Semantic color only
Green, red and amber appear only in market data.
Density
Controlled density
Compact patterns keep eleven widgets readable.
The system keeps visual intensity low so market changes, not decoration, carry attention.
10 · Scope
MVP scope: one monitoring loop, clear boundaries
The MVP focuses on helping users configure a workspace, monitor tracked assets, understand signals and add new assets through discovery.
PHASE 01
Configure
Setup·Workspace generation·Guided Tour
PHASE 02
Monitor
Watchlist·Widgets·Signals·Market Brief
PHASE 03
Discover
Screener·Asset Preview·Add to Watchlist·Workspace updates
Guardrails
No trading execution
No portfolio accounting
No exchange integration
No external alerts
No templates
No financial advice
Boundary principle
SignalDesk explains market context. It does not execute trades or tell users what to buy or sell.
11 · Validation plan
Validation plan: what I would test next
Concept prototype: these are validation targets, not shipped metrics.
01
Faster attention check
Identify the highest-priority tracked asset faster
Open workspace→Find flagged asset→Explain why
Asset named first, without scanning every widget
02
Less tool switching
Fewer external tools during one check-in
Complete task→Note tools users try to open
No external charting, derivatives or news tool needed
03
Clearer first-time comprehension
Understand Workspace, Watchlist and Signals after onboarding